Test Kolibri server performance#
Benchmark#
You can use the following command to collect information about the device where Kolibri server is running, and details about how much of its resources it is using. This command displays a snapshot of the server state at the time the command is executed, and its output will vary depending on the current server load. In case you suspect performance problems, type this in the Terminal or Command prompt.
kolibri manage benchmark
The command will have an output similar to this:
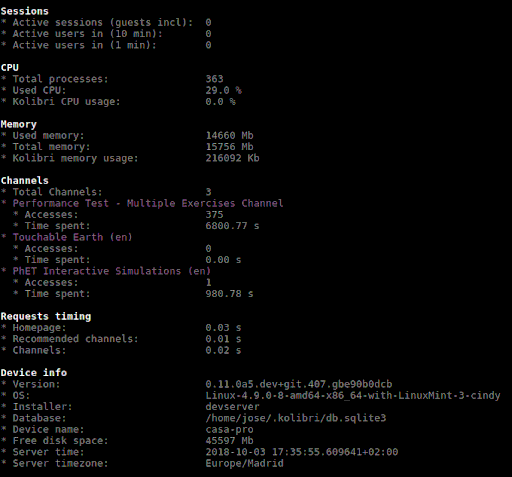
Command line output of the ‘kolibri manage benchmark’ command#
Take a screenshot of the Terminal or Command prompt, or copy and paste the output in the community forum post.
Profile#
In order to collect more than a current snapshot of Kolibri server performance, you can use the profiling command. When executed, the command will collect a series of performance indicators every 10 seconds and save them in a CSV file. Type this in the Terminal or Command prompt.
kolibri manage profile
Tip
Command collects and saves the information 60 times by default. If you want to change this value, add the --num-samples flag with the desired number at the end.
kolibri manage profile --num-samples=100
Each log line contains this information:
Date and time of each command execution
Number of Kolibri active sessions (including guest sessions)
Number of Kolibri logged users
Number of Kolibri user interactions during the last minute
Total percentage of CPU use
Total memory use
Total available memory
Number of processes executed in the server
Percentage of CPU used by Kolibri
Percentage of memory used by Kolibri
To help us troubleshoot potential problems on your Kolibri server, locate and send us the KOLIBRI_HOME/performance/date_time_performance.csv file.
Profile server requests#
If you have the [Server] section of the OPTIONS.INI file configured with PROFILE = 1, the above command will additionally perform a profiling of every request made by Kolibri server, and save the results in a second log file as KOLIBRI_HOME/performance/date_time_requests_performance.csv
Each log line contains this information:
Timestamp
Request path
Time spent processing the request
Memory (in KB) used by the Kolibri process when the request came in
Memory (in KB) used by the Kolibri process when the response was sent
CPU percentage used by the Kolibri process when the request came in
CPU percentage used by the Kolibri process when the response was sent
Flag indicating if the request is the slowest one since the analysis started
Warning
Profiling server requests can consume a lot of computer resources, and potentially slow it down. For this reason you need to explicitly allow it in the options.ini file. Without the PROFILE = 1 key, command will not profile server requests (but just the current server state), and it will not create the second CSV file.